Last year was the hottest experienced in Europe since records began, according to a climate report issued by the European Union.
It saw exceptionally warm weather in the months of February, June and July which led to record-breaking temperatures recorded across the continent.
Millions sweltered in the unrelenting heat, with Britain recording a new all-time high temperature of 38.7°C (101.7°F) set in Cambridge in late July.
Figures released today from the European state of the climate report from the EU’s Copernicus Climate Change Service (C3S) also reveals 11 of the 12 warmest years on record for the continent have occurred since 2000.
Rainfall was close to average for the year as a whole, but warm weather and drought lasted for several months. However, the yearly figure is skewed by a continued deluge throughout November.
The year’s penultimate month saw a staggering four times the normal amount of precipitation in Western and Southern Europe, covering much of the UK in floods.
Scroll down for video
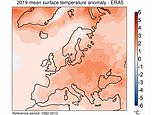
Pictured, a graph showing how the average surface temperature in 2019 exceeded the average temperature between 1982-2010. The EU’s Copernicus Climate Change Service (C3S) found Last year was the hottest experienced in Europe since records began
Pictured, how Europe’s average surface temperature has altered since 1982. It shows a continuing trend (red bars) showing the temperature continues to soar well above the average. This year’s study found 11 of the 12 warmest years on record for the continent have occurred since 2000
Pictured, a boy jumps into the water of the Trocadero Fountain in Paris during a heatwave on June 28, 2019. – The temperature in France on June 28 surpassed 45°C (113°F) for the first time as Europe wilted in a major heatwave
The analysis is the latest to be released by the Copernicus programme and includes a wide-range of data gathered from various sources.
It reveals a clear and damning warming trend for Europe stretching back over four decades.
‘The Copernicus report is important because the project uses different data streams and methods than commonly reported datasets from the UK Met Office, NASA and NOAA, explains Professor Kevin Cowtan at the University of York.
‘That they reach similar conclusions is further confirmation of the impact of human activity on global climate, which continues to progress largely in line with projections from both physical and statistical models.’
Other key findings of the EU-backed report are that average temperatures for the past five years are 1.1°C above pre-industrial levels globally.
However, Europe outstrips the worldwide norm, averaging almost 2°C warmer than the levels in the benchmark period of the latter 19th century.
This takes it recklessly close to failing the essential target of the Paris Agreement, ratified in 2015 which tasks countries with keeping temperature rises to ‘well below’ 2C above pre-industrial levels and to pursue efforts to curb warming to 1.5C.
Data gathered and presented in the Copernicus report is free to obtain for researchers and it is hoped it can help slow down global warming.
Pictured, how precipitation differed fromthe average betweeen october and December 2019. Blue indicates an increase above the norm in precipitation and red indicates a decrease compared to normal. Rainfall was close to average for the year as a whole, but the yearly figure is skewed by a continued deluge throughout November which caused devastating floods
November of 2019 saw a staggering four times the normal amount of precipitation in Western and Southern Europe, covering much of the UK in floods (pictured, a semi-submerged car in flood-waters on the edge of the village of Fishlake near Doncaster, northern England, on November 11, 2019)
Greenhouse gases continued to rise in 2019, EU-backed report finds
The EU’s Copernicus Climate Change Service (C3S) gathers a wide range of data on all factors related to the atmosphere.
This includes temperature, sunshine levels and precipitation but it also expands to include greenhouse gas emissions.
It found that in 2019, concentrations of carbon dioxide (CO2) and methane (CH4) continued to increase.
Both of these are greenhouse gases which trap heat on the surface of the planet.
They are known to be major contributors to global warming and reducing these emissions is a key goal for climate campaigners, scientists and governments alike.
Global net fluxes of greenhouse gases such as carbon dioxide, methane and nitrogen dioxide follow a continuing upward trend, a pattern which has established over recent decades.
Scientists say it is only possible to find concentrations as high as they were in 2019 by going back millions of years in history.
Carlo Buontempo, Director of the Copernicus Climate change Service (C3S), says: ‘It is now more vital than ever before that everyone has access to this information to help us understand the longer-term implications of climate change and what organisations and individuals can do to reduce its effects.
‘One exceptional warm year does not constitute a warming trend, but to have detailed information from our operational service, that covers many different aspects of our climate, we are able to connect the dots to learn more about how it is changing.’
The implications of continued and extreme global warming are severe.
Despite cooler temperatures for much of the year over the European Arctic, the ubiquitous summer heatwave caused record surface ice loss in Greenland.
A separate and independent study from Columbia University published last week found clear skies and warm temperatures in 2019 are responsible for the worst year on record for Greenland’s vast ice sheet.
Last year, Greenland ice sheet’s mass balance — which accounts for melting and snowfall — increased by only 50 billion tons, 320 billion tons less than the average for 1981-2010.
However, when researchers also accounted for ice that calves away and drifts into the ocean, it revealed Greenland’s ice sheet lost 600 billion tons in mass.
According to the researchers, this is equivalent to a global sea level rise of around 1.5mm.
Last year saw the largest number of sunshine hours, according to the EU Copernicus report. This sunshine duration was seen across the whole year with below-average cloud cover seen for the first six months
2019 saw more hours of sunshine than any year since the 1980s
Last year saw the largest number of sunshine hours, according to the EU Copernicus report.
The previous record year was 2015. This metric was first recorded in 1983 and 2019 saw the highest amount of sunshine hours since these records began.
This highlights a clear upward trend of sunshine hours over the last 40 years across the continent, the study authors say.
This sunshine duration was seen across the whole year with below-average cloud cover seen for the first six months.
Areas experiencing sunshine most above average were Spain, parts of France, central Europe and most of eastern Europe.
Unusually persistent bouts of high pressure over the country prevented the formation of ice, which led to a decrease in snowfall and an increase in ice melt.
The Greenland ice sheet contains enough frozen water to raise sea levels by as much as 23 feet (7m) if it was to disappear entirely.
Commenting on the latest report, Professor Hannah Cloke, a natural hazards researcher at Reading University, calls on the public to not forget about the ongoing climate crisis aid the global health pandemic.
She warned: ‘In lockdown, sitting on our sofas or our makeshift desks or in many more difficult situations, it would be easy for us to take our eyes off this alarming reality; that 2019 was the warmest year on record for Europe, that November brought us massively more precipitation than normal.
‘And for every decade I have been on this planet it has been getting hotter and hotter and hotter.’
Professor Rowan Sutton, from the National Centre for Atmospheric Science (NCAS) at the University of Reading, said Europe has been warming significantly faster than the global average.
‘This is for two reasons: First, land regions in general are warming faster than the oceans, largely because the greater availability of moisture over the oceans damps the rate of warming.
‘Secondly, reductions in specific forms of air pollution, ‘anthropogenic aerosols’, have contributed to the recent warming in Europe, particularly in summer.’
C3S is implemented by the European Centre for Medium-Range Weather Forecasts on behalf of the European Commission.
Source link
CHECK OUT: Top Travel Destinations
READ MORE: Travel News