Nervous flyers now have a powerful tool to help make their next flight all the more enjoyable – an interactive map that forecasts turbulence levels for their route.
It means that they can board a plane happy in the knowledge it’ll be a smooth ride if predicted turbulence levels are low or non-existent. And if rough air is on the itinerary? At least they know to expect it – and will have a good idea about how long it’ll last.
The map covers the globe and comes courtesy of turbli.com, which explains that it uses the same data sources that pilots and airlines use to plan their flights, ‘data that comes from advanced weather models developed by the National Oceanic and Atmospheric Administration (NOAA) and the MetOffice’.
Turbli.com’s interactive map, updated every six hours, offers forecasts for the current time, and three, six, nine or 12 hours into the future, across altitude levels between 4,200m (13,800ft) and 11,800m (38,700ft), which is a cruising altitude for many airliners.
Turbulence is marked in ‘heat map’ colour gradations that move from light blue to blue, and from orange to red.
Nervous flyers now have a powerful tool to help make their next flight all the more enjoyable – an interactive map that forecasts turbulence levels for their route. The map covers the globe and comes courtesy of turbli.com, which explains that it uses the same data sources that pilots and airlines use to plan their flights
Blue indicates light turbulence, with orange to red indicating moderate to strong or severe turbulence.
Turbli.com says that light turbulence equals a ‘smooth flight’; moderate bumps mean ‘difficulty in walking and with food services’; ‘strong’ results in ‘strong strains against seat belts’; and ‘severe’ turbulence results in ‘violent and sudden changes in altitude’.
Turbulence can also be defined as ‘extreme’, but here, an aircraft is ‘practically impossible to control’ and would be vanishingly rare. The kind pilots might never encounter in a career.
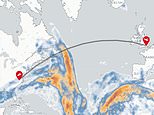
One of the most useful functions of the interactive map is that waypoints can be added.
Key in start and end points for a flight and a flightpath appears so users can see if it passes through any patches of turbulence. Click ‘get forecast’ and the site rustles up a turbulence graph for the trip.
Turbli.com also offers three static turbulence maps – for the world, the U.S and Europe.
These offer forecasts in three-hour steps to 24 hours into the future.
One of the most useful functions of the interactive map is that waypoints can be added. Key in start and end points for a flight and a flightpath appears so users can see if it passes through any patches of turbulence. Click ‘get forecast’ and the site rustles up a turbulence graph for the trip (inset on the map above)
Users can also input their flight into the website, which will then produce, as with the interactive map, a turbulence graph for the journey and a summation of how smooth it’ll be.
Want to be even more certain about the turbulence levels you’ll encounter? Turbli.com also has data on U.S pilot turbulence reports and marks on a map the locations where they’ve reported rough air.
Turbli.com adds: ‘Due to the chaotic nature of turbulence, turbulence forecasts are only accurate for the very near future: about two days ahead. Longer-range turbulence forecasts have proven to be very unreliable and are thus not used in aviation.’
Turbulence is marked in ‘heat map’ colour gradations that move from light blue to blue, and from orange to red. Blue indicates light turbulence, with orange to red indicating moderate to strong or severe turbulence
Turbli.com says: ‘Due to the chaotic nature of turbulence, turbulence forecasts are only accurate for the very near future: about two days ahead. Longer-range turbulence forecasts have proven to be very unreliable and are thus not used in aviation’
Turbli.com says that light turbulence equals a ‘smooth flight’; moderate bumps mean ‘difficulty in walking and with food services’; ‘strong’ results in ‘strong strains against seat belts’; and ‘severe’ turbulence results in ‘violent and sudden changes in altitude’
Further turbulence knowledge can be attained by studying turbli.com’s rankings for the most turbulent routes and airports of 2023.
The lists, as we reported, have been drawn up from the analysis of over 150,000 long-haul and short-haul flight records from 2023 to identify the most turbulent flight routes last year – on average – and a study of 500 of the world’s largest airports to discover which are the most jarring to fly into and out of.
Research conducted by the University of Reading indicates that turbulence during flights is on the rise, with severe turbulence increasing by 55 per cent since 1979.
However, you can console yourself with the knowledge that although turbulence may be uncomfortable and scary, it is extremely unlikely to cause your plane to crash.
As a long-haul Dreamliner captain who spoke to MailOnline stated: ‘In terms of what it might do to you, yes it’s unpleasant, nobody likes being bounced up and down like that, or very few people do, but it’s not unsafe… Aircraft like flying, they don’t like falling out of the sky, and you’ve got to try pretty hard to make them do that.’
MOST TURBULENT ROUTES 2023 OVERALL WORLDWIDE AND IN EUROPE, AMERICA AND OCEANIA
10 MOST TURBULENT ROUTES WORLDWIDE
1. Santiago (SCL) – Santa Cruz (VVI)
2. Almaty (ALA) – Bishkek (FRU)
3. Lanzhou (LHW) – Chengdu (CTU)
4. Centrair (NGO) – Sendai (SDJ)
5. Milan (MXP) – Geneva (GVA)
6. Lanzhou (LHW) – Xianyang (XIY)
7. Osaka (KIX) – Sendai (SDJ)
8. Xianyang (XIY) – Chengdu (CTU)
9. Xianyang (XIY) – Chongqing (CKG)
10. Milan (MXP) – Zurich (ZRH)
10 MOST TURBULENT ROUTES IN EUROPE
1. Milan (MXP) – Geneva (GVA)
2. Milan (MXP) – Zurich (ZRH)
3. Geneva (GVA) – Zurich (ZRH)
4. Marseille (MRS) – Zurich (ZRH)
5. Zgornji Brnik (LJU) – Zurich (ZRH)
6. Nice (NCE) – Basel (BSL)
7. Nice (NCE) – Zurich (ZRH)
8. Yerevan (EVN) – Tbilisi (TBS)
9. Basel (BSL) – Venezia (VCE)
10. Frankfurt am Main (FRA) – Caselle Torinese (TRN)
10 MOST TURBULENT ROUTES IN AMERICA
1. Nashville (BNA) – Raleigh/Durham (RDU)
2. Charlotte (CLT) – Pittsburgh (PIT)
3. Denver (DEN) – Puerto Vallarta (PVR)
4. New York (JFK) – Raleigh/Durham (RDU)
5. Warwick (PVD) – Syracuse (SYR)
6. Atlanta (ATL) – Dulles (IAD)
7. Pittsburgh (PIT) – Raleigh/Durham (RDU)
8. New York (LGA) – Portland (PWM)
9. Boston (BOS) – Syracuse (SYR)
10. Boston (BOS) – Philadelphia (PHL)
10 MOST TURBULENT ROUTES IN OCEANIA
1. Brisbane (BNE) – Sydney (SYD)
2. Port Vila (VLI) – Auckland (AKL)
3. Melbourne (MEL) – Sydney (SYD)
4. Port Vila (VLI) – Brisbane (BNE)
5. Port Vila (VLI) – Sydney (SYD)
6. Port Vila (VLI) – Melbourne (MEL)
7. Brisbane (BNE) – Melbourne (MEL)
8. Brisbane (BNE) – Adelaide (ADL)
9. Brisbane (BNE) – Darwin (DRW)
10. Auckland (AKL) – Christchurch (CHC)
Source: turbli.com. Based on an analysis of 150,000 routes.
What can turbulence do to the airframe?
He said: ‘Nothing. By the time airframe breaks up you’ll be dead anyway.’
He revealed that pilots basically have four options for dealing with turbulence.
He said: ‘You can grin and bear it – the aircraft is more than capable of withstanding the loads associated with turbulence – although severe turbulence can be quite uncomfortable and best avoided for passenger comfort. You can try flying higher – if aircraft performance allows it – or lower – although this burns more fuel and might make things worse.
‘You can fly at the aircraft turbulence penetration speed – generally a little slower than normal cruising speed or turn to avoid the area of turbulence if it’s localised, such as near a thunderstorm.’
Veteran Air Canada Dreamliner captain Doug Morris adds in his book This Is Your Captain Speaking (ECW Press): ‘Don’t think pilots are up in the flight deck saying nonchalantly “oh well”. We don’t like rough air either. It wears on everyone.’
MOST TURBULENT AIRPORTS 2023 OVERALL WORLDWIDE AND IN EUROPE, AMERICA AND OCEANIA
10 MOST TURBULENT AIRPORTS WORLDWIDE
1. Santiago (SCL)
2. Natori (SDJ)
3. Wellington (WLG)
4. Sapporo (CTS)
5. Osaka (KIX)
6. Bishkek (FRU)
7. Tokoname (NGO)
8. Lanzhou (LHW)
9. Tokyo (HND)
10. Christchurch (CHC)
10 MOST TURBULENT AIRPORTS IN EUROPE
1. Vienna (VIE)
2. Zurich (ZRH)
3. Marseille (MRS)
4. Geneva (GVA)
5. Zgornji Brnik (LJU)
6. Athens (ATH)
7. Stavanger (SVG)
8. Pisa (PSA)
9. Sochi (AER)
10. Bratislava (BTS)
10 MOST TURBULENT AIRPORTS IN NORTH AMERICA
1. Portland (PDX)
2. Denver (DEN)
3. Las Vegas (LAS)
4. Vancouver (YVR)
5. Salt Lake City (SLC)
6. Prince George (YXS)
7. Calgary (YYC)
8. Quebec (YQB)
9. Reno (RNO)
10. Seattle (SEA)
10 MOST TURBULENT AIRPORTS IN OCEANIA
1. Wellington (WLG)
2. Christchurch (CHC)
3. Melbourne (MEL)
4. Sydney (SYD)
5. Brisbane (BNE)
6. Adelaide (ADL)
7. Perth (PER)
8. Auckland (AKL)
9. Nouméa (GEA)
10. Darwin (DRW)
Source: turbli.com. Based on an analysis of 500 of the world’s largest airports.
Source link
CHECK OUT: Top Travel Destinations
READ MORE: Travel News